Using dynamic visual variables for visualizing efficiency in route maps

| Led by: | Fuest, Sester |
| Team: | Samsondeen Dare |
| Year: | 2021 |
| Is Finished: | yes |


(Un)fortunately, as the world becomes more urbanized and the population density of cities continue to increase, there has been a proportional increase in automobile dependence. This has resulted in high traffic density, increased air pollution, higher road risks, amongst other side effects. For example, in traffic density, effective traffic distribution is still an ongoing challenge for traffic management agencies. In addition to time cost, traffic density also contributes to higher maintenance cost and adverse environmental effects due to more fuel consumption.
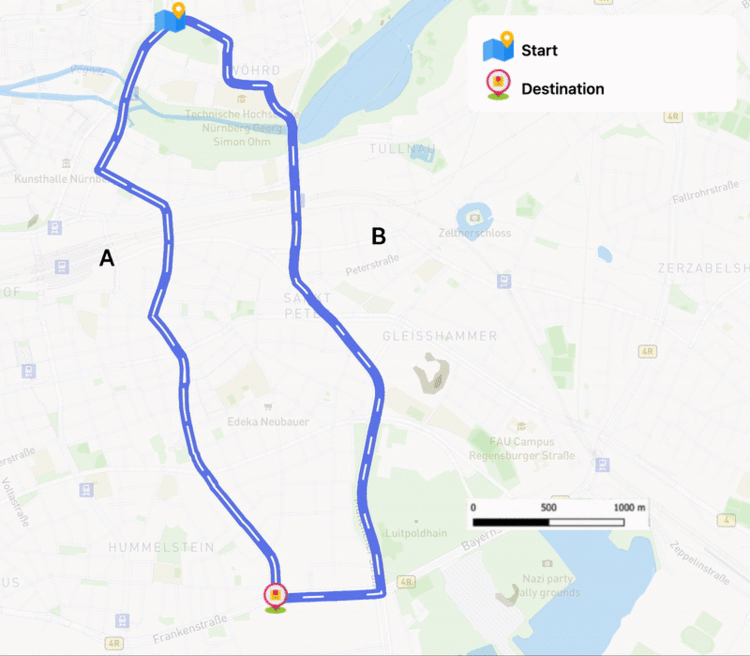
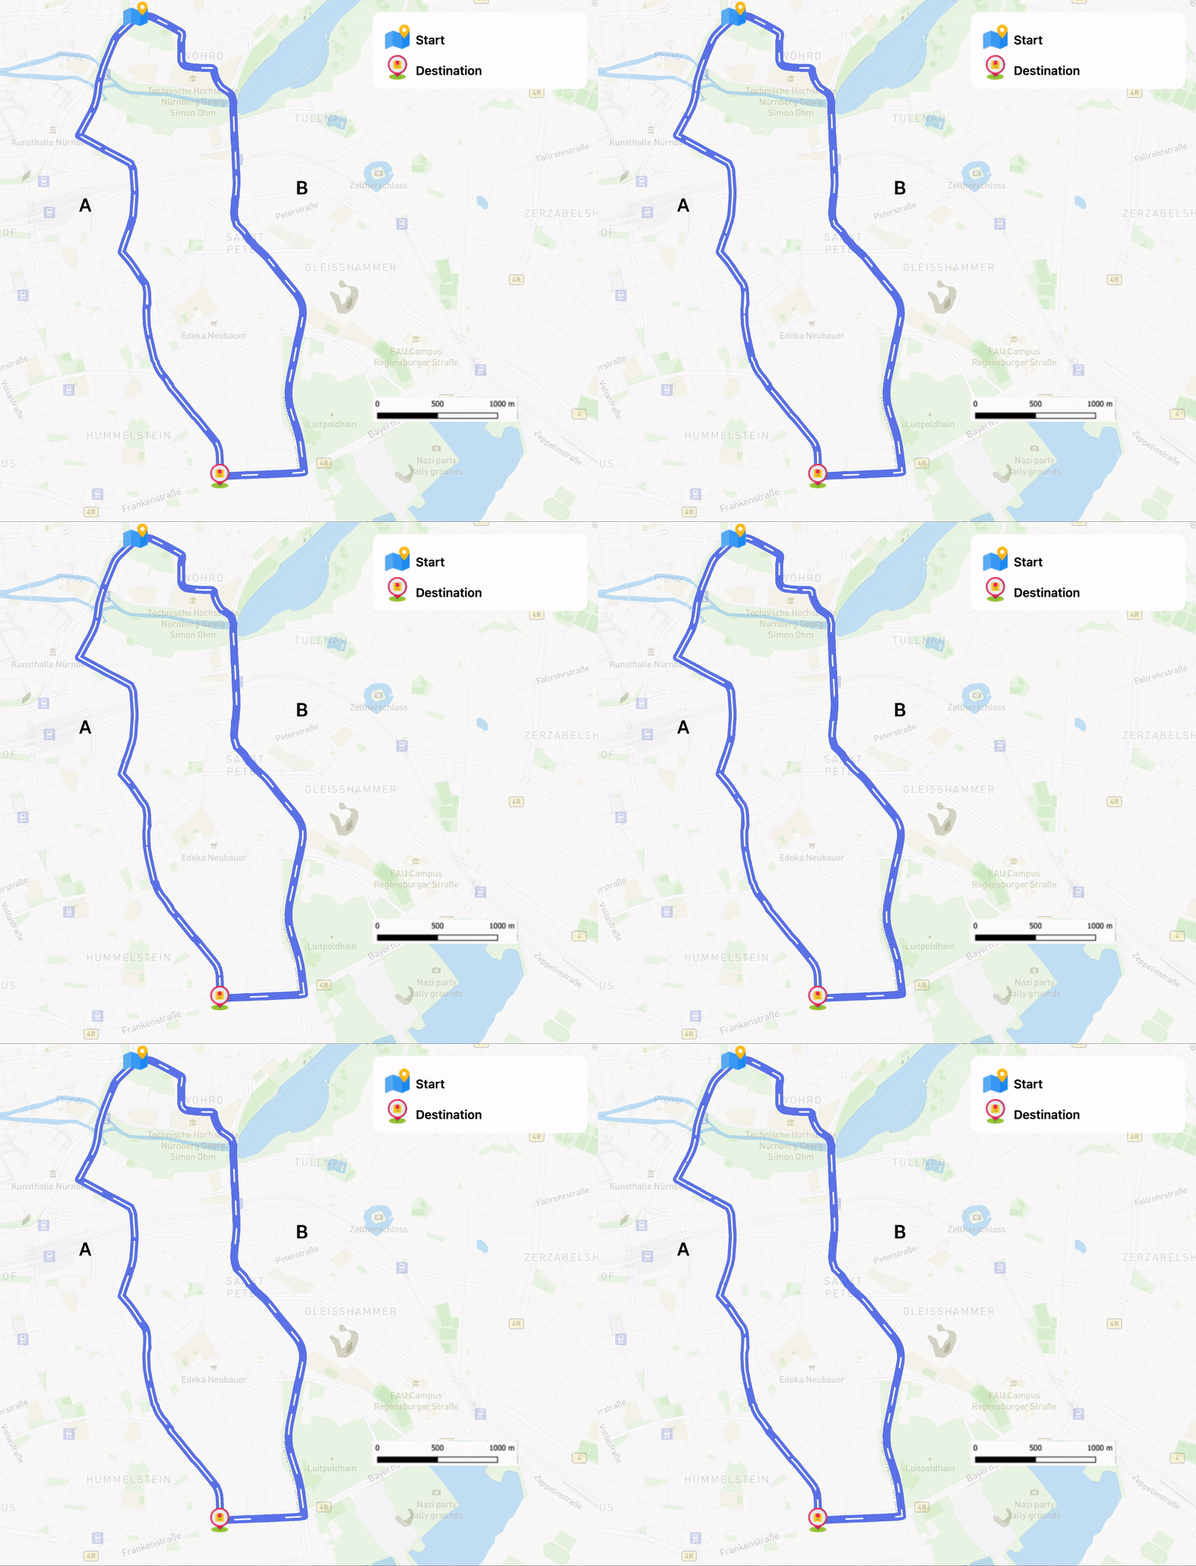
Over the years, maps have served as cartographers favourite communication model for conceptualizing the real world. Visualizing traffic information along routes weren’t left out, as mapmakers have used route maps for many years to communicate directions along a path. The maps often involve a lot of cartographic generalization techniques to abstract the essential information. With the increasing acquisition of large quantities of data made possible by technological advancement, simple cartographic techniques have become insufficient in rendering such huge data. Map visualization has gone through many iterations over time, to the point where dynamic visualizations are now possible, thanks to advanced graphics technology. This thesis aims to develop dynamic visualization variants based on the dynamic visual variables defined by MacEachren et al. and evaluate the effectiveness of these variants in communicating route efficiency to users and how we can use the dynamic variables to influence route choice.
The Thesis focuses on a use case of recommending a longer, but favourable route to the map-reader, using map animation for visualizing the temporary efficiency or inefficiency of different route options. This recommended route is not always the faster or shortest one, but rather the route that optimizes the traffic situation, probably for a given scenario that strives towards achieving overall benefit for society. In evaluating our developed variants, the results showed that dynamic visualizations are effective in visually communicating route choice. While there is not much advantage over the statically modified visualizations, the variants that depict traffic showed a significant improvement from the static visualizations. The variants were also found to be effective in communicating different scenarios.
